The sonographer finishes the scan, hands you the report, and says: “Everything noted, your doctor will explain.” You look at the sheet. You see numbers like “EFW: 1.48 kg (18th centile),” “UA PI: 1.2,” “AFI: 13.8 cm,” and a string of measurements next to abbreviations you have never encountered before.
Most women sit with that paper all the way home, searching every number on their phone. What they usually find is either alarming or confusing.
This guide explains what a growth scan report actually measures, what the numbers represent, and what it means when a doctor recommends closer monitoring. I am a radiologist. I produce these reports. Here is what I would tell you if you were sitting across from me.
What this post covers:
- What a growth scan is and when it is done
- The four measurements and how EFW is calculated
- How to read your centile: what the 10th, 50th, and 90th centile mean
- Why one scan is less informative than serial scans
- Doppler indices: umbilical artery PI, RI, and end-diastolic flow
- The middle cerebral artery and the cerebroplacental ratio
- Amniotic fluid: AFI versus maximum vertical pocket
- What the biophysical profile is
- The monitoring pathway when a scan raises a question
What a Growth Scan Is and When It Is Done
A growth scan (also called a third-trimester growth scan or a fetal growth and wellbeing scan) is an ultrasound done after 24 weeks of pregnancy to assess how the baby is growing and, in most cases, to look at blood flow through the umbilical cord using Doppler technology.
For more on this, read our guide on Early Pregnancy Scan. Timing varies depending on your clinical picture:
Routine growth assessments in low-risk pregnancies are usually done at 28 and 32 weeks in many units, or sometimes at 36 weeks before discussing delivery plans.
Serial growth scans in higher-risk pregnancies are done every 2 to 4 weeks in women with conditions that can affect placental function: high blood pressure, pre-eclampsia, diabetes, previous pregnancies with growth problems, twin pregnancies, or reduced fetal movements. For these pregnancies, the high-risk pregnancy care pathway includes regular scan surveillance as a planned part of management.
Unscheduled growth scans may be requested when a baby is measuring smaller than expected at an antenatal appointment, when there are concerns about fetal movements, or when your doctor wants to check the fluid around the baby.
A growth scan takes around 20 to 30 minutes. It is performed transabdominally, with gel on the abdomen. The bladder does not need to be full at this gestation. Sometimes, if the baby’s position makes certain measurements difficult, you may be asked to walk around and return.
The Four Measurements and How EFW Is Calculated
The radiologist measures four structures of the baby’s body and reports them in millimetres alongside their gestational-age equivalent (how many weeks and days the measurements correspond to):
HC (Head Circumference): The outer circumference of the fetal skull measured at the level of the thalami and cavum septi pellucidi, a defined anatomical plane. HC reflects cranial growth and is influenced by brain development.
BPD (Biparietal Diameter): The widest transverse diameter of the fetal skull at the same axial plane. Sometimes reported alongside HC, sometimes instead of it, depending on the laboratory’s protocol.
AC (Abdominal Circumference): The circumference of the fetal abdomen measured at the level of the umbilical vein and fetal stomach. This is the most sensitive measurement for nutritional status. When a baby is not getting enough from the placenta, the liver (which sits within the abdomen) is one of the first organs to show reduced growth, because the fetus diverts blood to protect the brain. A lagging AC relative to HC can be an early signal.
FL (Femur Length): The length of the femur, the thigh bone. FL is a proxy for skeletal maturation and overall fetal length.
From these four measurements, the formula calculates the Estimated Fetal Weight (EFW). The most widely used formula is Hadlock’s equation, which combines HC, AC, and FL. EFW is expressed in grams or kilograms, and then plotted against a growth reference chart to determine the centile.
It is important to note that EFW is a statistical estimate, not a direct weighing. Most studies put the margin of error at around 10 to 15 percent in either direction. A baby reported as EFW 2.1 kg may actually weigh between 1.8 and 2.4 kg. This is why clinical decisions are never made on a single EFW figure alone.
How to Read Your Centile
The centile (or percentile) tells you where your baby sits relative to a population of babies at the same gestational age.
50th centile: your baby’s EFW is exactly the median for this gestational age. Half of babies at this stage weigh more, half weigh less.
10th centile: your baby’s EFW is at the lower boundary of the expected range. 90 percent of babies at this gestation weigh more.
90th centile: your baby’s EFW is at the upper boundary. 90 percent of babies at this gestation weigh less.
The Fetal Growth Longitudinal Study of the INTERGROWTH-21st Project, published in The Lancet in 2014 (Papageorghiou AT et al., PMID 25209488), established international reference standards for fetal growth based on serial ultrasound measurements from healthy, well-nourished pregnancies across eight countries. These standards are now used in many Indian tertiary centres, though some units continue to use country-specific or locally validated charts.
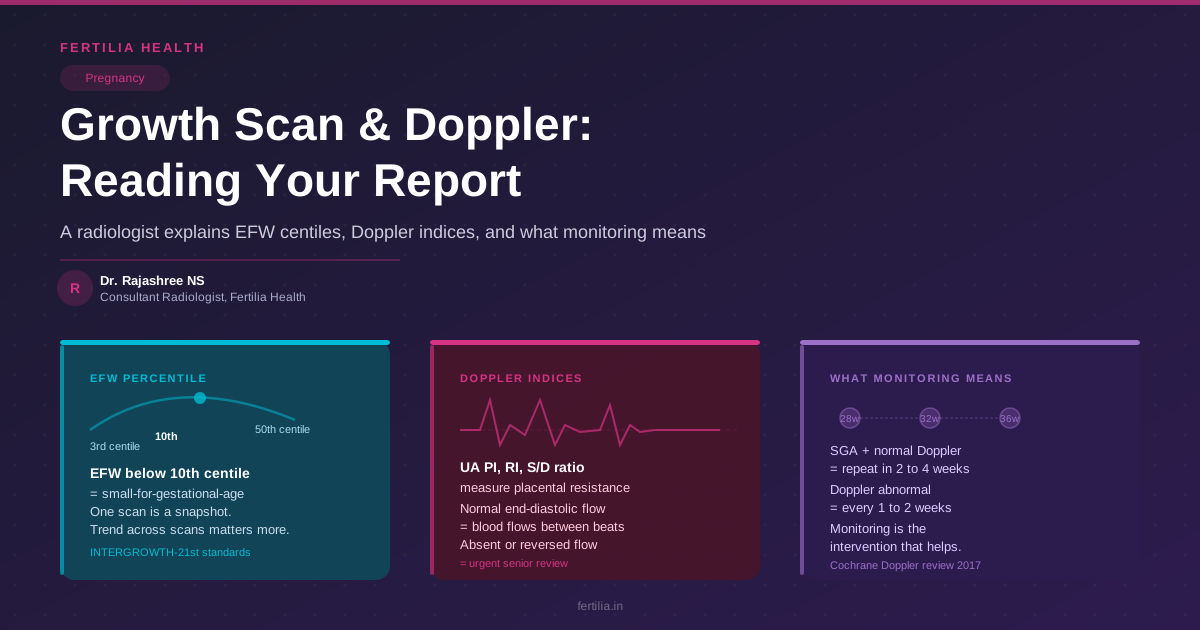
Below the 10th centile is the commonly used threshold for defining a small-for-gestational-age (SGA) fetus. Not every SGA fetus has a problem. Some are small because their parents are small, or because the baby is simply on the smaller end of the normal range. The question the radiologist and your obstetrician work through together is whether the baby is small but well (growing steadily on their own centile, with normal Doppler and normal fluid) or small because the placenta is not delivering what it should. The first group needs reassurance. The second group needs monitoring, and sometimes earlier delivery.
Below the 3rd centile is a stricter threshold used in some guidelines, particularly when combined with Doppler abnormalities, to define fetal growth restriction (FGR) requiring close surveillance (Gordijn SJ et al., Ultrasound in Obstetrics and Gynecology, 2016, PMID 26909664).
For a complete explanation of the clinical side of this distinction, including what FGR means for your pregnancy and what the monitoring pathway looks like from your obstetrician’s perspective, see the IUGR and fetal growth restriction guide.
Why One Scan Tells You Less Than Serial Scans
A centile on a single scan is a snapshot. What matters clinically is the growth trajectory: is the centile stable, rising, or falling over time?
A baby who measures 28th centile at 28 weeks and 26th centile at 32 weeks has grown at the expected rate and stayed on their curve. That is reassuring.
A baby who measures 38th centile at 28 weeks and 18th centile at 32 weeks has crossed centile lines downward. The four-week interval is the number that prompts action, not the 18th centile in isolation.
This is why your doctor may say “the single measurement looks fine, but let’s repeat in four weeks.” The repeat scan is not anxiety. It is how the information becomes interpretable.
Doppler Studies: Reading the Umbilical Artery Values
Doppler ultrasound measures blood flow by detecting the Doppler shift in sound waves as they bounce off moving red blood cells. In the context of a growth scan, the most important vessel to assess is the umbilical artery, which carries blood from the baby back to the placenta.
The umbilical artery waveform shows a sharp peak during systole (when the heart contracts and pushes blood forward) and a lower flow during diastole (between beats). Three values are commonly reported:
S/D ratio (Systolic/Diastolic ratio): The height of the systolic peak divided by the level of diastolic flow. In a healthy placenta, diastolic flow is high because the placenta offers low resistance to blood flow. As the placenta becomes less efficient, resistance increases, diastolic flow drops, and the S/D ratio rises.
RI (Resistance Index): (S minus D) divided by S. A different way of expressing placental resistance. Both RI and S/D ratio carry the same clinical information; laboratories tend to prefer one or the other.
PI (Pulsatility Index): (S minus D) divided by the mean flow. PI is considered more reliable than RI because it can still be calculated when end-diastolic flow is absent (a situation where RI would give a mathematically undefined result).
Normal PI values for the umbilical artery decrease with advancing gestation, because a healthy growing placenta progressively reduces its resistance as the pregnancy progresses. Reference ranges depend on gestational age; your laboratory report should flag whether the value is within or outside the expected range for the gestation shown.
End-diastolic flow is the key clinical signal to understand:
- Normal end-diastolic flow: the waveform maintains a positive component throughout the cardiac cycle. This is reassuring.
- Reduced end-diastolic flow: the diastolic component is present but lower than expected for the gestation. This is an early warning that warrants closer monitoring.
- Absent end-diastolic flow (AEDF): the waveform touches the baseline between heartbeats. No forward flow during diastole means the placenta has significantly raised resistance. This finding triggers more frequent monitoring and, depending on the gestation and other markers, discussion of timing delivery.
- Reversed end-diastolic flow (REDF): the waveform dips below the baseline during diastole, meaning blood is actually flowing back from baby toward the placenta between beats. This is the most severe Doppler finding and represents critical placental compromise. It almost always prompts urgent senior review and delivery planning.
The Cochrane systematic review by Alfirevic et al., published in 2017 (PMID 28613398), reviewed 19 trials involving over 10,000 pregnancies. It found that the use of Doppler ultrasound in high-risk pregnancies was associated with a reduction in perinatal deaths and fewer unnecessary interventions compared with monitoring without Doppler. This is the evidence base for why Doppler studies are now standard in any growth scan done for a clinical reason.
If you have received a growth scan report with Doppler values and are not sure what the numbers mean for your pregnancy, Dr. Suganya’s team is available to review the report with you. We work online, pan-India, by video call. Message us on WhatsApp to start the conversation.
The Middle Cerebral Artery and the Cerebroplacental Ratio
When umbilical artery Doppler is abnormal, the radiologist will usually assess the middle cerebral artery (MCA) as well.
The MCA carries blood to the fetal brain. In a healthy pregnancy, the brain has relatively high resistance because it does not need maximum blood flow at rest. When the baby comes under placental stress, the brain protects itself by dilating its vessels and reducing resistance: a response called brain-sparing or cerebral redistribution. On Doppler, this shows up as a low MCA PI.
The cerebroplacental ratio (CPR) is calculated by dividing the MCA PI by the umbilical artery PI. A CPR below 1.0 (or below the 5th centile for gestational age in some guidelines) suggests that the brain is beginning to prioritise its own blood supply at the expense of other organs. This finding carries weight in the decision about timing delivery, particularly when the baby is also small.
Amniotic Fluid: AFI and Maximum Vertical Pocket
The growth scan report almost always includes an amniotic fluid assessment. There are two methods:
AFI (Amniotic Fluid Index): The sonographer divides the uterus into four quadrants and measures the deepest pocket of fluid in each. The four measurements are added together. A normal AFI in the third trimester is generally between 8 and 24 cm. AFI below 5 cm is the threshold for diagnosing oligohydramnios (reduced fluid). AFI above 24 cm suggests polyhydramnios (excess fluid).
MVP (Maximum Vertical Pocket): The deepest single pocket of fluid, measured vertically, with care to exclude loops of cord. An MVP below 2 cm indicates oligohydramnios; above 8 cm suggests polyhydramnios.
Many centres now prefer MVP over AFI because it appears to have a lower false-positive rate for diagnosing low fluid, meaning fewer women are flagged as having a problem when the fluid is actually acceptable. Your report will specify which method was used.
Fluid levels matter because amniotic fluid is primarily produced by the fetal kidneys and recirculated through swallowing. When placental function is compromised and the baby is not receiving enough blood flow, urine production falls and fluid volume drops. Falling AFI over serial scans is an additional signal alongside Doppler abnormalities.
For more detail on the clinical implications of low fluid, see the oligohydramnios guide. For excess fluid, see the polyhydramnios guide.
What the Biophysical Profile Is
Some growth scans, particularly when Doppler is abnormal or the baby is a concern, include a biophysical profile (BPP). The BPP is a structured 30-minute real-time ultrasound observation that scores five parameters, each given a score of 0 or 2:
- Fetal breathing movements (at least one episode of 30 seconds or more)
- Gross fetal body movements (at least three discrete movements)
- Fetal tone (at least one episode of extension and return to flexion)
- Amniotic fluid volume (one pocket at least 2 cm in two perpendicular planes)
- Cardiotocography (non-stress test, reactive pattern): sometimes included in the modified BPP
A score of 8 or 10 out of 10 (or 8 out of 8 if CTG is excluded) is reassuring. A score of 6 or below on a repeated assessment prompts urgent review and usually leads to further management (Manning FA, Clinical Obstetrics and Gynecology, 2002, PMID 12438875).
The BPP reflects acute fetal status. A baby who has recently eaten well and is actively moving will score high. For this reason, a single low BPP in the absence of other abnormal markers is usually repeated before acting on it. The BPP is one more piece of the picture, interpreted alongside growth, Doppler, and clinical context.
What Close Monitoring Means in Practice
When a growth scan raises a question, the next step is almost always more observation, not immediate action. Here is what the monitoring pathway typically looks like:
SGA (below 10th centile) with normal Doppler and normal fluid: repeat growth scan in 2 to 4 weeks. Many of these babies will continue on their lower centile and be entirely well. The purpose of the repeat is to confirm stability.
SGA with mildly abnormal Doppler (elevated PI, reduced end-diastolic flow): more frequent monitoring, often every 1 to 2 weeks. Your obstetric team will discuss the threshold for delivery based on gestation, the degree of Doppler abnormality, and other factors.
Absent end-diastolic flow: admission to a unit with neonatal intensive care facilities is often advised in many guidelines, with daily or twice-daily monitoring. Delivery timing is a careful balance between the risks of premature birth and the risks of continued compromise.
Reversed end-diastolic flow: urgent senior review. Delivery within 24 to 48 hours is common in most settings where the fetus is at a viable gestation.
Falling growth centile but normal Doppler: your doctor may increase scan frequency to confirm whether the fall is continuing. Some centile drift is within normal variation; a consistent downward trajectory over three scans is more significant.
What is worth understanding is that the monitoring itself is not a cause for alarm. It is the mechanism by which your team can make a confident decision at the right time. A baby watched closely from 28 weeks with serial scans and Doppler studies is a baby whose team will not be caught off-guard.
For context on what the anomaly scan at 20 weeks checks before the third-trimester growth surveillance begins, see the anomaly scan guide.
Frequently Asked Questions
What is a normal EFW centile on a growth scan? Most guidelines consider EFW above the 10th centile for the gestational age to be within the normal range, though this is a population threshold, not a precise biological cutoff. What matters as much as the centile is whether it is stable across serial scans. A baby consistently at the 12th centile on three consecutive scans is often better than one who has dropped from the 55th to the 22nd centile in six weeks. Your doctor reads the trend alongside the number.
What does the umbilical artery PI on my report mean? PI (pulsatility index) measures the resistance the placenta offers to blood flow from the baby. A PI within the reference range for your gestation means blood is flowing through the placenta at an expected resistance. An elevated PI suggests resistance is higher than expected, which may indicate the placenta is not working at its best. Whether this warrants action depends on the degree of elevation, the gestation, and whether end-diastolic flow is still present.
My growth scan showed AFI of 6 cm. Is that too low? An AFI of 6 cm is in the lower range but technically above the 5 cm threshold for oligohydramnios. Many centres would want to confirm the measurement using MVP (maximum vertical pocket) as well. A borderline AFI of 6 cm with normal Doppler and normal baby movement is usually monitored with a repeat scan within a week or two. If it falls below 5 cm on a careful repeat measurement, your team will discuss next steps.
The report says “HC greater than AC.” What does that mean? The head circumference (HC) and abdominal circumference (AC) normally grow at similar rates. When HC is proportionally larger than AC, it can suggest that the baby’s abdomen is not receiving as much blood flow as the brain, a pattern called asymmetric growth restriction or brain-sparing. This is one of the patterns associated with placental insufficiency. Your obstetrician will correlate this finding with the Doppler values and the overall EFW centile.
How accurate is the EFW on a third-trimester growth scan? The EFW is an estimate with a margin of error of approximately 10 to 15 percent in either direction. This is inherent to the measurement technique: the formula calculates weight from external circumference measurements, not from directly weighing the baby. In practical terms, a scan showing EFW 2.5 kg might mean the actual weight is anywhere from about 2.1 to 2.9 kg. This is why no single EFW figure drives a management decision on its own. The direction of change between two scans, and the Doppler values, carry more weight than the EFW number alone.
What does “brain-sparing” mean on a scan report? Brain-sparing refers to a pattern where the middle cerebral artery (MCA) PI is low relative to the umbilical artery PI, giving a cerebroplacental ratio (CPR) below 1.0. It means the fetal brain is dilating its blood vessels to protect its own supply when the placenta is under strain. The brain-sparing response is an adaptive mechanism, but identifying it signals that the fetus is compensating for stress, not that the brain is damaged. It is one of the markers your team will track to help decide when delivery offers the best outcome.
Can I do anything to improve the growth scan result before the next appointment? Eating well and staying rested support what the placenta is able to deliver, but there are no foods or supplements that directly increase placental function or make a baby grow faster if there is genuine restriction. What does matter: attending every scheduled monitoring scan, keeping your team informed of changes in fetal movement, and following the advice about position and activity your obstetrician gives you. In genuine cases of FGR, close surveillance is the intervention that makes the difference, and attending that surveillance is within your control.
If you have a growth scan result you are trying to make sense of, or if you are in the third trimester with regular monitoring and want support alongside your specialist care, the Fertilia team works with women online, pan-India, by video call. Message us on WhatsApp to start the conversation.
Dr. Rajashree NS is a Consultant Radiologist with MD Radio-diagnosis (The Tamil Nadu Dr. M.G.R. Medical University) and MBBS (Sri Balaji Vidyapeeth, Puducherry). TNMC Reg. No. 154966. She writes for Fertilia on ultrasound, imaging, and scan-report interpretation in women’s health.